Defining and studying an “ideal blade” has informed our blade innovation over the years and has led to the development of our most efficient blades: the Smoothie2 Vortex Edge and Fat2 blades.
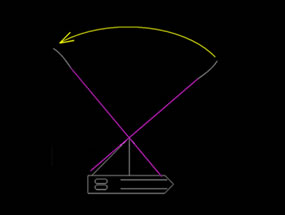
The Typical Blade Path During the Drive
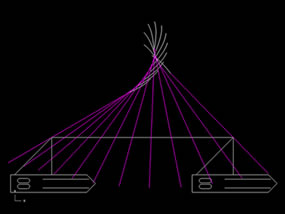
Contrary to how it might look, an oar blade does not travel in a continual arc through the water as represented in Figure 1. This would only be true if the boat were tied up to a dock. The typical path of the blade, as the boat moves past the point of entry, is the complex movement shown in Figure 2.
Below, the blade path is illustrated by an image taken from an overhead video of an actual oar in the water.
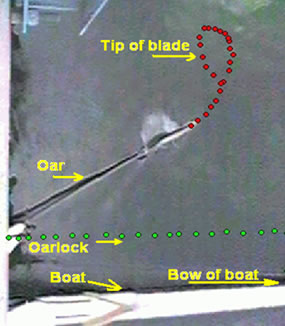
We define this typical blade path as having four distinct phases:
- Phase 1: Forward Blade Motion—The blade moves significantly forward, toward the finish line.
- Phase 2: Outward Blade Motion—The blade moves outward, away from the boat.
- Phase 3: Backward Blade Motion—The blade moves backward, toward the starting line.
- Phase 4: Inward Blade Motion—The blade moves inward, toward the boat.
Having identified the typical blade path, we can now examine how a theoretical ideal blade would move and what this might tell us about how to best harness the rower’s effort during the drive.
The Ideal Blade
We define the ideal blade as having:
- Zero slip perpendicular to the blade surface.
- No resistance to movement in line with the shaft; in other words, it would glide.
- The ability to rotate in the water. We will define the point of rotation as the point where the blade and shaft join.
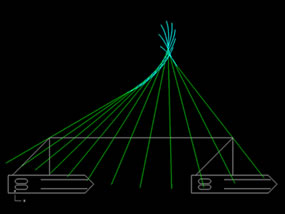
Developing a New Blade Path
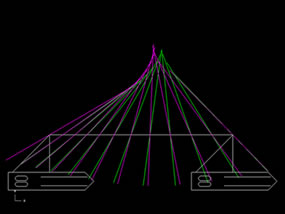
Keeping in mind that boat movement influences blade path, and that blade movement is defined by the characteristics of the ideal blade, we plotted what the ideal blade path would be. We have assumed that the boat speed would be the same as for the typical path, so the position of the oarlock is the same as in each frame of the typical path diagram. Each new oar position was then plotted between the oarlock and the new blade position as defined by our ideal blade. See Figure 3.
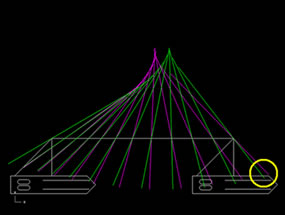
In Figure 4 we have superimposed the ideal path (green) and the typical path (red) with the blades removed for clarity.
Observation 1: Shorter Outboard Length
Our first observation is the handle positions noted by the circle. It appears as though the ideal oar has not completed the stroke. To adjust for this we shortened the outboard length used with the ideal blade and re-plotted as before. This is illustrated in Figure 5.
Observation 2: Slower Rotation at Beginning of Drive
After superimposing the two blade paths, we noted that at the beginning of the drive, the ideal oar rotates more slowly than the typical oar and then speeds up in the second half of the drive.
To the rower, this means the ideal blade will feel heavier early in the drive and feel lighter after the oar reaches perpendicular. From a physiological standpoint, it makes sense to maximize blade efficiency at the same point of the stroke when the rower is using his or her large muscles to power the drive. From the perpendicular to the finish, only the upper body and arms are engaged, so it also makes sense that the load becomes lighter and handle speed increases in this phase of the drive.
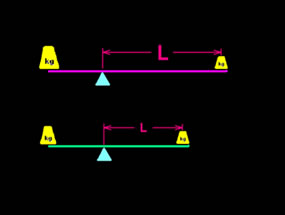
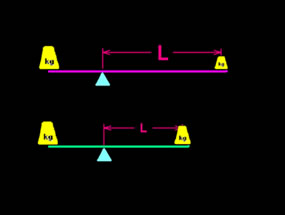
Observation 3: Less Work Required to Move the Same Speed
Once the ideal oar was shortened, we were able to achieve the same catch and finish angles and the same amount of drive time as that of the oar in the typical blade path. The boat also moved the same distance, indicating that it moved at the same speed regardless of which oar was used. Because the outboard lever is shorter in the ideal blade path, the force on the handle is less, which means that less work is required to move the boat the same speed. This also means that if the same force is applied on the handle, the force on the end of the shorter oar will be greater. In other words, the rower will get more speed for equal effort.
Observation 4: Less Slip
By observing blade movement during oar rotation, we noted that the ideal blade slips less. Note the image below. The slip pattern of the ideal blade is on the right. Of course, this is expected by definition of the “ideal blade.”
We also see that the typical blade slips more during the first part of the drive and doesn’t slip enough during the last part of the drive. The area shaded red indicates a backwatering condition where the part of the blade near the shaft produces some negative thrust, or drag. This is created by the combination of blade rotation and forward movement of the boat.
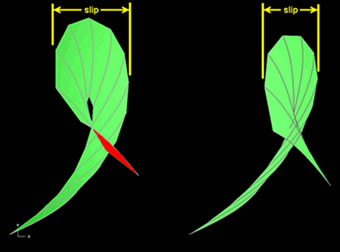
Typical Blade
Ideal Blade
Pursuing a Blade that Approaches the Theoretical Ideal
With an increased understanding of what would produce an efficient blade, we set off to design a new blade by targeting specific blade features.
- Surface area—Increased surface areas tend to resist slippage perpendicular to the blade surface.
- Curvature/hook—Flatter blades generate a heavier feel earlier in the drive, allowing for slower rotation.
- Tip characteristics—Vortex generating features reduce slippage perpendicular to the blade surface.
- Tip shape—Tapered blade edges create a force on the back of the blade, increase lift, and reduce slip, much like the delta wing effect in aeronautics.
We built these features into our Smoothie2 Vortex Edge and Fat2 blades, making them the most efficient blades we offer. Read more about how we conduct on water testing.